|
|
|
|
Letter to the Editor |
COVID-19
Pneumonia: Experiences Regarding the Use of Computed Tomography in Diagnosis
and Follow-up COVID-19 Pnömonisi: Tanı ve Takipte Bilgisayarlı Tomografi’nin
Kullanımı ile İlgili
Deneyimler *Mehmet
TAHTABAŞI1 [ID] Dear Editor The unknown
pneumonia cases firstly reported in Wuhan city of China in December 2019,
then disease was named coronavirus disease (COVID-19)
and the causative virus was named as severe acute respiratory syndrome
coronavirus 2 (SARS-CoV-2), and following it was declared by the World Health
Organization (WHO) as a global public health emergency on January 30, 2020 [1-4]. Real-time
reverse transcriptase polymerase chain reaction (rRT-PCR) is accepted as the
gold standard for diagnosis, which is the most important step in the control
and management of the outbreak. However, high false negativity rates may lead
to delay in the isolation and medical treatments of suspected cases and
increase the risk of transmission [5]. Therefore, computed tomography (CT) plays a very
important role in the detection of viral pneumonia in clinically suspected
cases, and high accuracy rates of CT have been reported by referring to
rRT-PCR in studies [6]. If the
patient has epidemiological history and clinical features in terms of viral
pneumonia, even if the second rRT-PCR is negative, it should be accepted as
positive for COVID-19 infection, considering the CT findings, and such
patients should be evaluated with follow-up CT for the course of COVID-19
pneumonia and the rRT-PCR test should be repeated for confirmation of
diagnosis [6,7]. In the
meantime, clinically diagnosed cases should be isolated and treated to reduce
the risk of transmission. CT can be considered as a useful test in situations
where rapid decision is required due to delayed results, lack of kit and
false negative test results. CT imaging
features of COVID-19 pneumonia In most of the
studies, COVID-19 typically occurs with ground glass opacity (GGO) with
peripheral, posterior, diffuse or lower zone distribution and GGO has been
shown to be alone or together with consolidation [8-11]. It has also
been reported that GGO often has a rounded morphology or shows a "Crazy
paving" pattern [8,10]. However, the
majority of cases have opacities with no clear or specific distribution, and
the dominant perihilar pattern has not been reported [10]. Bronchial
wall thickening, mucus plugs, nodules (tree-in bud and centrilobular), which
are common in infections, are not typical in this disease [10].
Lymphadenopathy and pleural effusion have been reported rarely [8,12]. The frequency
of imaging findings is also related to when infected patients are imaged. A
small majority of patients may have a negative CT in the first 2 days from
the onset of symptoms, and GGO usually occurs 0-4 days after symptom onset
and peaks at 6-13 days [10,11,13]. For this
reason and according to our observations; being negative in CT, especially in
early disease, may not be enough to rule out the possibility of COVID-19 and
the frequency of consolidation increases in the later stages of the disease
course [Figure
1,2]. In addition, the frequency of the "reversed
halo" sign, which is not typically found near the onset of the disease,
also increases in the following periods [10]. Follow-up CT
indications, ranges and dosage for patients with
COVID-19 We have
experienced that one of the characteristic features of COVID-19 pneumonia is
its rapid progression, and the best method to evaluate the progression of the
disease is radiological imaging. Chest X-ray is recommended in severe and
critical cases followed up in intensive care because of its ability to make
bed head and portability. CT is the best method to show lesions and follow-up
due to its high resolution. Follow-up intervals may vary from one day to 14
days depending on the progression of lung lesions and the development of
acute respiratory distress syndrome (ARDS) or the resolution of regression.
CT protocols have been reported in two types, normal and low dose. Normal
dose CT is recommended because round and small GGO, which are early imaging findings
in the initial stage, will be overlooked in low-dose CT. However, considering
the amount of radiation dose taken in a short time, it is recommended to
prefer low-dose CT in follow-up. According to
the accepted consensus, control CT is recommended between 3-5 days in cases
where the initial CT is normal, and 5-7 days in cases with pneumonia findings
[14]. Shorter
intervals are recommended in those who have normal initial CT and develop
pneumonia rapidly. Systematic
research should be conducted to develop initial descriptive assessments on
COVID-19 pneumonia, which creates a huge socioeconomic burden worldwide.
Combined big data combining epidemiological, clinical, laboratory and imaging
findings will provide improvement in diagnostic criteria and treatment
management. Sharing clinical and radiological experiences in different
regions will have a positive outcome for this devastating epidemic.
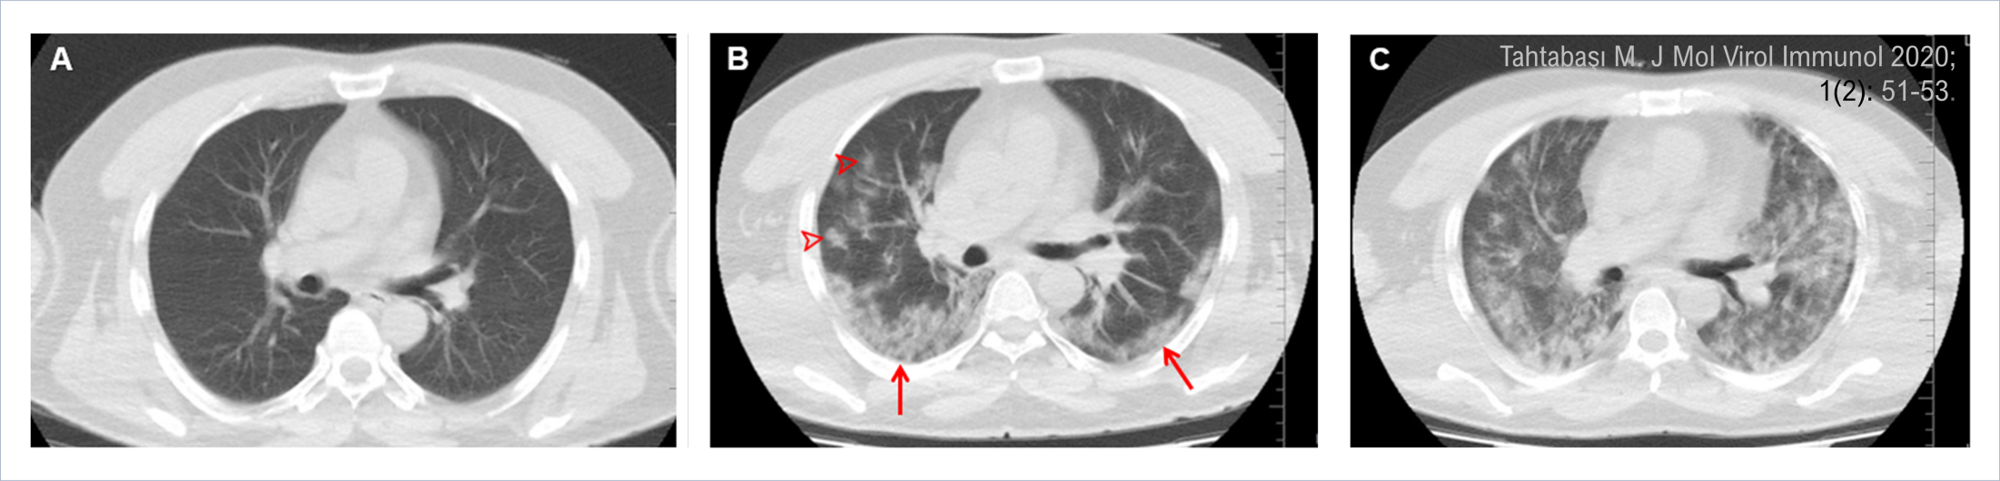
Figure 1. Initial
and follow-up computed tomography (CT) images of a 48-year-old male patient
with positive rRT-PCR. A) Initial CT (day one) shows that the lung is normal.
B) CT on the fifth day showing patchy ground glass opacities (arrowheads)
and Crazy paving pattern (arrows) posteriorly. C) CT on day 19 shows
that the lesions have progressed, and acute respiratory distress syndrome has
developed (at this stage, the patient is treated in the intensive care unit). Figure 1 png Şekil 1. Pozitif rRT-PCR'li 48 yaşındaki erkek hastanın ilk ve takip
bilgisayarlı tomografi (BT) görüntüleri. A) İlk BT (birinci gün) akciğerin
normal olduğu görülmekte. B) Beşinci gün BT’sinde posteriorda yamalı buzlu
cam opasiteleri (ok başları) ve Crazy paving paterni (oklar) izlenmekte. C)
19. gün BT'de lezyonların ilerlediği ve akut solunum sıkıntısı sendromu
geliştiği görülmekte (bu aşamada hasta yoğun bakımda tedavi ediliyor). Figure 1 png
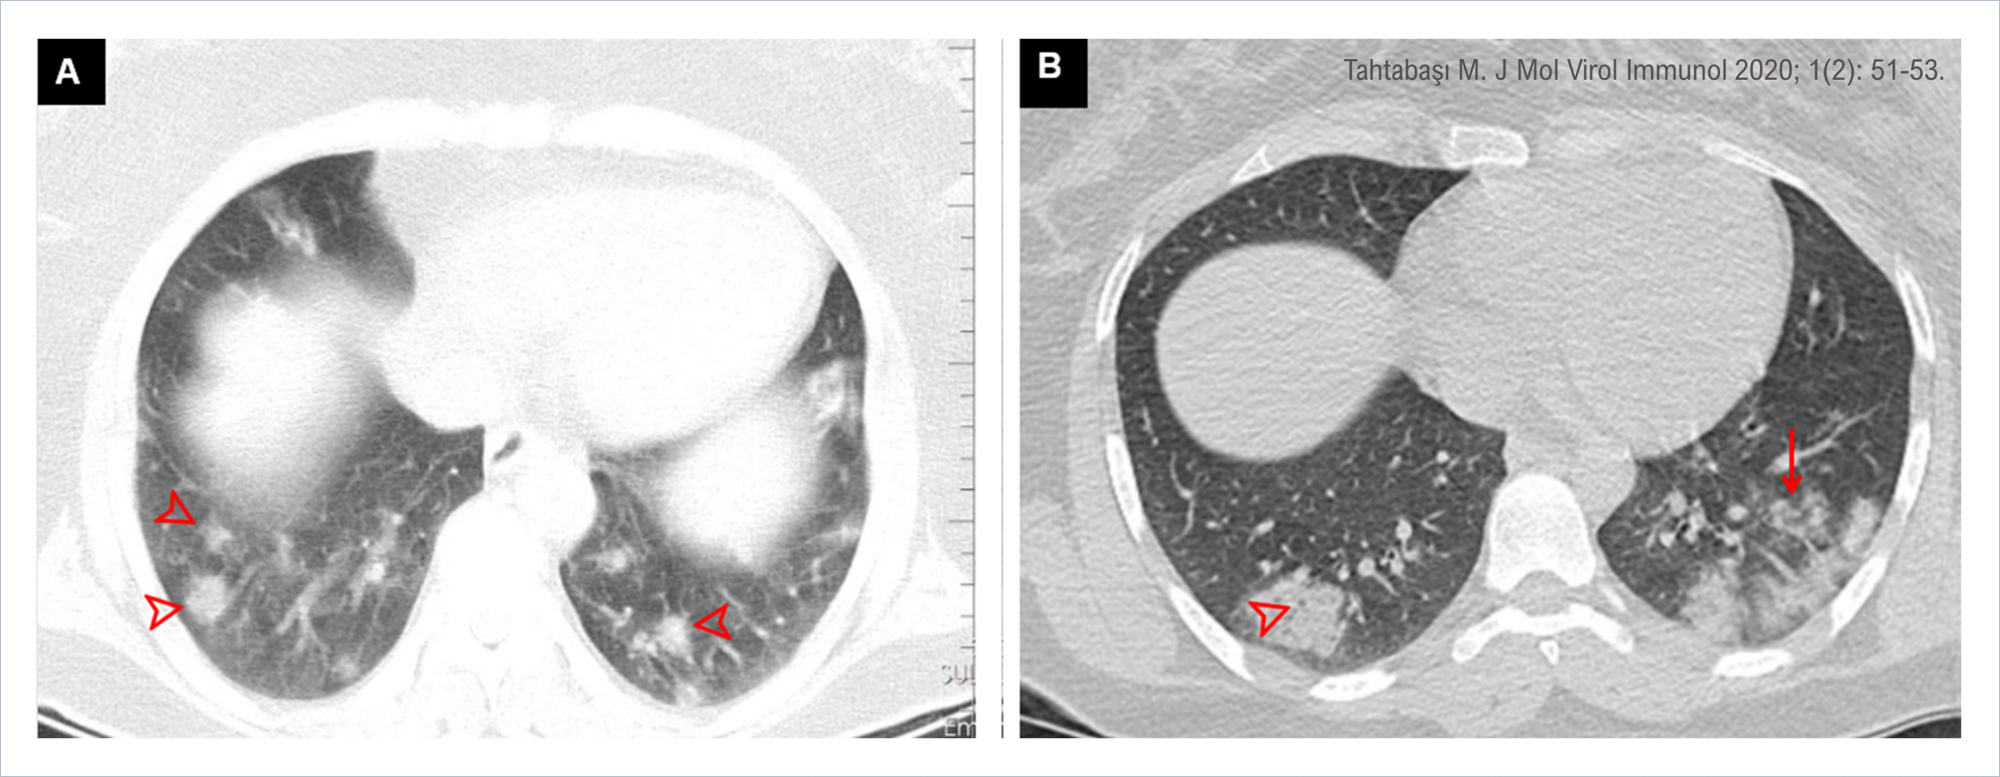
Figure
2. Chest CT images of two different patients
with positive rRT-PCR test in the lung window. A) CT images show multiple
ground glass opacities (arrowheads) located in the lower lung lobes
and periphery of both lungs. B) CT images of a different patient show ground
glass opacities and patchy consolidations (arrow) in the lower lobes
and periphery of the lung. Pay attention to the air bubble sign (arrowhead)
within the lesion. Figure 2 png Şekil 2. Akciğer penceresinde
rRT-PCR testi pozitif olan iki farklı hastanın göğüs BT görüntüleri. A) BT
görüntülerinde alt akciğer loblarında ve her iki akciğerin periferinde yer
alan çoklu buzlu cam opasiteleri (ok başları) görülmekte. B) Farklı bir
hastanın BT görüntülerinde akciğerin alt loblarında ve periferinde buzlu cam
opasiteleri ve yamalı konsolidasyonlar (ok) görülmekte. Lezyon içindeki hava
kabarcığı (air bubble) işaretine dikkat ediniz (ok başı). Figure 2 png |
|
DOI: 10.46683/jmvi.2020.12 |
|
|
Article in English |
|
|
|
|
|
|
|
|
1Department of Radiology, University of Health Sciences- Mehmet Akif
Inan Education and Research Hospital, Sanliurfa, Türkiye. |
|
|
|
|
|
*Corresponding author Mehmet Tahtabaşı; Asst.Prof.,
Department of Radiology, University of Health Sciences- Mehmet Akif Inan Education
and Research Hospital, Sanliurfa, Türkiye. E-mail: mehmettahtabasi@gmail.com |
|
|
|
|
|
Received: 14.09.2020 Accepted: 23.09.2020 Published: 24.09.2020 |
|
|
Cite as: Tahtabaşı
M. COVID-19 Pneumonia: Experiences Regarding the Use of Computed Tomography
in Diagnosis and Follow-up. J Mol Virol Immunol 2020; 1(2): 51-53. |
|
|
|
|
|
View in academic indexes and databases |
|
|
|
|
|
|
|
|
|
|
|
|
|
|
|
|
|
|
|
|
|
|
|
|
|
|
|
|
|
|
|
|
|
|
|
|
|
|
|
|
|
|
|
|
|
|
|
|
|
|
|
|
|
|
|
|
|
|
|
|
|
|
|
|
|
|
|
|
|
|
|
|
|
|
Cited by 3 articles*, 0 book chapter. |
|
|
[1]* Tahtabaşı M,
Karaman E, Akın Y, Konukoğlu O, Kılıçaslan N, Gezer M, Er S, Tez S, Tez M,
Tekin K. Catching the First Wave in the Pandemic: A Retrospective Evaluation
of Chest CT Images for COVID-19. J Mol Virol Immunol 2021; 2(3): 67-74. doi: 10.46683/jmvi.2021.33 |
|
|
[2]* Tahtabasi M,
Kılıcaslan N, Akın Y, Karaman E, Gezer M, Icen YK, Sahiner F. The Prognostic
Value of Vertebral Bone Density on Chest CT in Hospitalized COVID-19
Patients. Journal of Clinical Densitometry 2021; S1094-6950(21)00061-5. doi: 10.1016/j.jocd.2021.07.007 PubMed: 34353732 |
|
|
[3]* Bolat A, Cüce
F, Şenoğlu MÇ, Şahiner A, Ünay B. Efficacy of Clinical and Chest Radiography
Features in Predicting Patient Prognosis in Children with COVID-19. J Mol
Virol Immunol 2021; 2(4): 159-167. doi: 10.46683/jmvi.2021.43 |
|
|
©Copyright JMVI.
Licensed by Creative Commons Attribution-NonCommercial 4.0 International (CC
BY-NC 4.0). |
|